It is generally expected that many intracellular deficiencies for eg. silicon, magnesium, iodine, selenium, molybdenum, copper, zinc and others may show in your CMA and / or Oligoscan data (and that functional deficiencies for iron, manganese, copper and six others may exist in any (deprecated) HTMA data, indicating inflammation severity over time.)
Assuming inflammation and pH imbalances are correctly managed, resolving these deficiencies may take, eg.
2 or more months, via non-oral routes, eg. sublingual / transdermal / rectal, providing acidaemia and renal dumping has been resolved.
1 - 2 weeks via appropriately dosed parenteral administration, providing acidaemia and renal dumping has been resolved. This can then be easily maintained via non-oral routes.
NB. These deficiencies are likely not going to resolve at all using standard oral dosing, due to mineral transport inhibition in the duodenum.
If your Oligoscan and/or OAT data shows low phosphorus, the upstream causes for this need to be addressed as a priority, or else remineralisation will be highly problematic. Common upstream influences include the various issues affecting mitochondrial metabolism, to the point of triggering lactic acid metabolism (anaerobic glycolysis). Some of these include insufficient pacing, zinc status, oxidative stress support and oxygen transport / coagulation.
If you are using the compounded nutrients, a number of these minerals
and various vitamins are combined using a sublingual or DMSO-enhanced route, which greatly simplifies this part of the protocol. The
default formulation should suffice for most
people, unless your transferrin saturation is at or above 35-40%, in which
case you would reduce the ferritin content to zero. Where the transferrin saturation exceeds 45%, ie. "iron overload", checking for and remediating cobalt deficiency is suggested, along with excluding any causes of methemoglobinemia. (see “4.2 Compounded nutrients” section)
Please recheck your CMA / Oligoscan for progress on remineralisation regularly (and HTMA, as desired, for progress on inflammation, strontium and rubidium). Adjust mineral supplements as needed if remineralisation is slow. There appears to be a bell curve response for absorption of many metals, where around 5-10% of the total system stores is the upper limit, per day and further efforts result in active blockade. Similarly, absorbing a reasonable amount of excess minerals is not normally problematic unless you have, for example, Wilson’s disease, hemochromatosis or beta thalassemia. These diseases are rare, however need careful management.
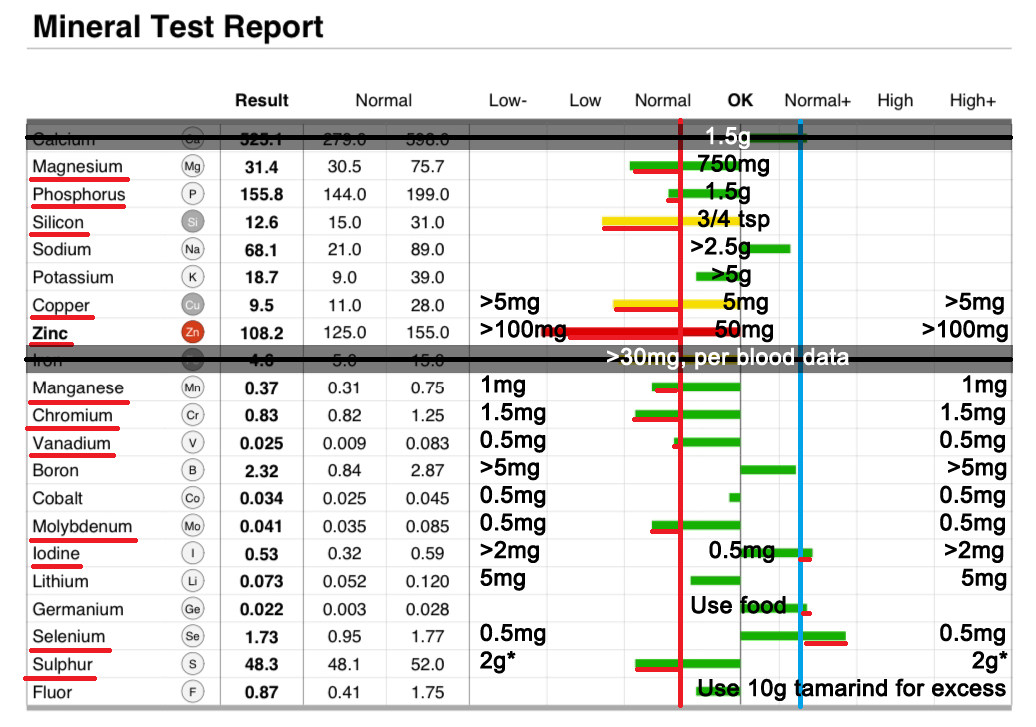
Where an element is indicated as non-optimal, you can use these suggested (elemental) minimum daily doses below, relative to the interpreted lower threshold.
Based on our collected data, we interpret Oligoscan / SO/Check reports using different upper and lower thresholds than the provider’s report layout indicates.
For Oligoscan reports, VISUALLY, the "Low" threshold is relocated to halfway between the original Low and OK vertical lines, (ie. where the “a” in “Normal” is located, to the left of “OK”) and the "High" for all markers except fluorine is relocated to halfway between OK and original High vertical lines (ie. where the “o” in “Normal+” is located, to the right of “OK”).
Numerically, if you wanted to do this computationally, Oligoscan "Low" and "High" threshold values for each marker would be recalculated as:
Low=(((Low+High)/2)+Low)/2
High=(((Low+High)/2)+High)/2
NB. According to the 2024 Oligoscan practitioner's guide*, due to an unusual quirk in methodology / reporting, highly elevated minerals (to the right of our vertical blue line / upper threshold in the image below and usually indicated as yellow or red bar) need to be re-interpreted as highly deficient. This also applied to SO-Check reports. If you see this anomaly in your data, it would be advisable to confirm this by taking a CMA test, if possible. Otherwise, default to reinterpreting the marker as proportionally "low".
*The practitioner's guide discusses zinc transport blockade as the reason for the marker elevation. From our comparisons with CMA data, the issue also applies to other markers and appears to be something do to with the "trade secret" Oligoscan algorithm. Ultimately, I think this could be improved.
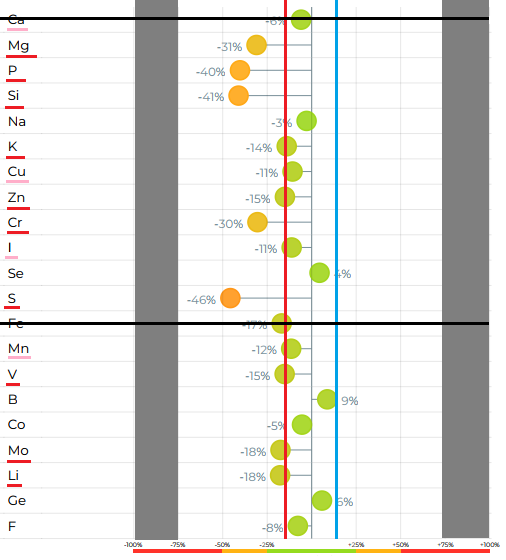
For So/Check branded reports, these have a different format / layout and markers are shown as a percentage deviation from “normal” instead of values. You can ignore this report’s two outer columns to use the dosing guide image above.
1. The same methodology "quirk" relating to elevated values in Oligoscan applies to So/Check, as do the higher sensitivity thresholds for interpretation.
2. So/Check Calcium and Iron are discarded / ignored for the same reason as Oligoscan.
3. So/Check Copper and Zinc markers may also be over-stated.
4. Numerically, the So/Check mineral and electrolyte markers have a reinterpreted lower in-range threshold of -14% and an upper in-range threshold of +14%, instead of +/-25%.
Marker values which are INSIDE the +/- 14% threshold are interpreted normally as progressively lower or higher than the ideal target, which is 0%, ie. "in-range, low" and "in-range, high".
Marker values which are OUTSIDE of these +/- 14% thresholds in either direction are both interpreted as "LOW" and are considered progressively worse on a scale, the further the value deviates from 0%, OUTSIDE of the new thresholds. For example, +/- 30% would be "VERY LOW", +/- 50% would be "CRITICALLY LOW".
5. In-range low markers should still be supported by diet and/or supplementation.
Although no longer used in this protocol, elevations of electrolyte excretion in hair tests can indicate low cellular uptake with dietary sufficiency, causing enhanced excretion. Where a hair mineral profile shows low potassium and similarly low rubidium, the rubidium deficiency will need correcting or else potassium levels may be difficult to restore. Similarly, calcium with strontium and magnesium with lithium. High zinc can indicate low histidine / insufficient protein.
An important note on hypoxia and acidosis:
Low phosphorus in Oligoscan or OAT data can indicate parathyroid issues,
acetaldehyde and/or (metabolic/respiratory or renal) acidemia.
(Lactic) acidemia is commonly seen with (chronic infection -> immune activity -> coagulation ->) hypoxia.
Elevated oxalate and/or relative elevation of lactic acid vs pyruvic acid in the OAT results are further indication for hypoxia.
If chronic hypoxia is present, additional support may well be required. (see: "2.3.3 Blood-flow, hypoxia and fibrin-amyloid")
NB. Correcting hypoxia is expected to help remove innate immune bias towards IFN-alpha response and assist IFN-gamma activity. Initial elevated immune response, fatigue and die-off symptoms could be expected when starting these interventions. Pre-protocol support items may be useful in supporting this period.
Failure to address hypoxia / acidemia will stall remineralisation and microbiome remediation. (see: "2.3.2 Remineralisation")
Low sulfur in Oligoscan or So/Check data can indicate elevated transsulfuration, sulfur metabolising microorganisms or microbial oxalate issues.
Low iodine is often observed with fluorine excess. Fluorine is found in medicines, toothpaste and town water. Consuming 10g of tamarind paste per day can dramatically increase excretion of fluorine.
If you have taken a blood test for iron, transferrin, transferrin saturation% and ferritin and the transferrin saturation% is below 18%, you have a critical need for iron supplementation before Stage 3. However most oral supplements will not absorb and can feed pathogens.
For other supplement selection criteria:
Earlier / manual guidance:
“Do I need P5P?”
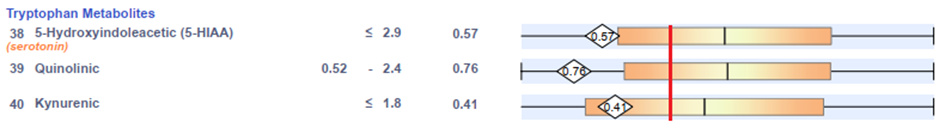

38, 39, 40, 75 – where no SSRI, melatonin or 5-HTP supplement is being used, if these markers are all in the lower range, this can infer low P5P levels, via (38) aromatic L-amino decarboxylase (AADC) [+ P5P] ⇒ monoamine oxidase (MAO) [+ riboflavin as FAD], via (39) kynureninase (KYNU) [+ P5P, less oxidative stress] and via (40) kynurenine aminotransferase (KAT) [+ P5P / zinc / magnesium], via (75) as 4-aminobutyrate transaminase (4ABT) [+ P5P] ⇒ SSAL [+ NADPH] -> GHB}. Part of this pattern assumes dietary tryptophan is sufficient.

51 – Pyridoxic acid / pyridoxate is a degradation metabolite of B6 / pyridoxal, which can be used to infer pyridoxal LESS any aldehyde dehydrogenase (ALDH) activity [NAD+ / magnesium / zinc deficiency, acetaldehyde], pyridoxine 5'-phosphate oxidase (PNPO) activity [riboflavin as FMN, tissue damage / TGF-b1 inhibition, hypoxia] and aldehyde oxidase (AO) activity [riboflavin as FAD, molybdenum, heme, iron+sulphur, hypoxia].
“Do I need biotin?”

57 – Methylcitric is used to indicate biotin availability. If this marker is out-of-range in either direction, sublingual biotin will need to be carefully used.
“Do I need trimethylglycine (TMG) / betaine?”
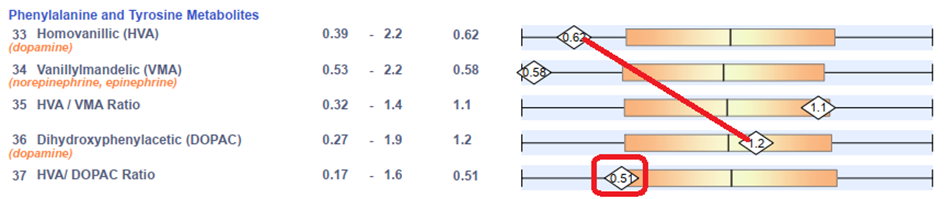
37 (36:33) – The lower the integer in 37, the more likely you are to benefit from some methylation support. 3,4-dihydroxyphenylacetic acid (DOPAC) ⇒ homovanillic acid (HVA) involves 1 enzymatic reaction – catechol O-methyltransferase (COMT), which requires S-adenosylmethionine (SAMe) as a cofactor. SAMe is produced by the methylation cycle. These markers can be confounded by overgrowth of certain bacteria and by renal synthesis of dopamine.

41:42 – This ratio can also help interpret methylation status. An unbalanced ratio of uracil:thymine can indicate low activity at thymidylate synthase OR low pentose phosphate pathway activity - > PRPP, R1P, R5P affecting uridine pyrophosphorylase, along with NAD+ synthesis, purine synthesis, glycogen synthesis, etc.. If uracil is also low, this could further indicate dietary protein insufficiency.
“Do I need Vitamin B5”

52 – This marker can help indicate a vitamin B5 deficiency, which will affect lipolysis and pathways reliant on coenzyme-A (many). Elevated 16 / HPHPA may also benefit from more B5 to produce CoA. If in doubt, include B5 - it's not known to have tolerance issues, although if you're deficient it can be stimulating at first until the pathways rebalance.
“Does my OAT and Oligoscan / CMA data correlate?”
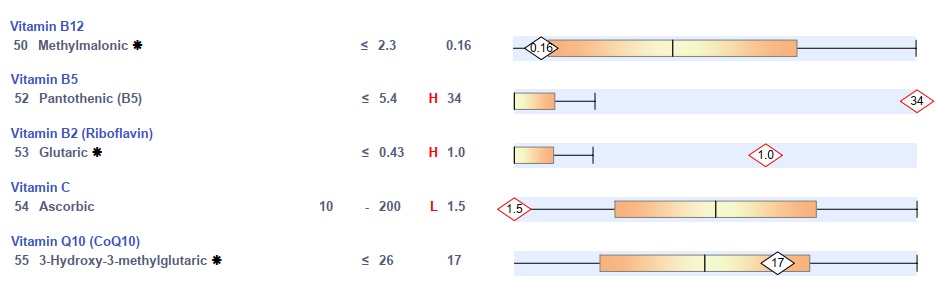
50 - Vitamin B12
52 - Vitamin B5 / pantothenic acid
53 - Vitamin B2 / riboflavin
54 - Vitamin C / Ascorbic acid
55 - CoQ10

76 – Either elevated or low (excreted) urine phosphoric acid should correlate well with a LOW (intracellular) Oligoscan phosphorus marker. If they do not, please share your data and report this in our Discord discussion group for further analysis.